
1. Introduction and first impressions
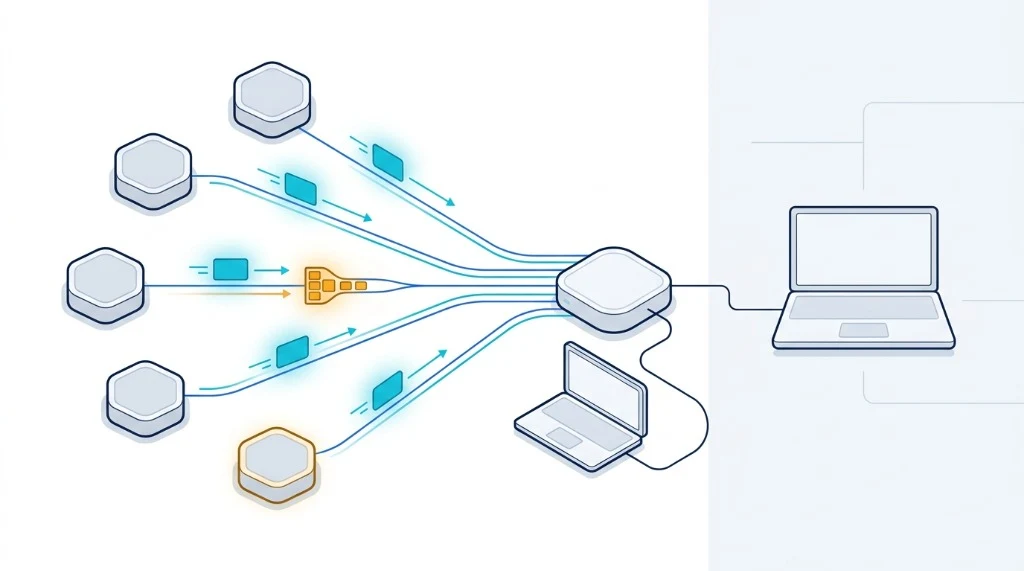
I like the question this tool asks: “Does one network path act much worse than the others?” That is more useful than one big download number. My concern is the jump from different to throttled.
This is a desk review of the public interface, launch claims, testing logic, and competing methods. I did not complete a controlled broadband benchmark from a lab line. That matters. The score is provisional, and the article does not invent results.
VelocityVerify focuses on real-world bandwidth, loaded latency, Wi-Fi performance, and ISP traffic shaping. That background makes this a natural product to examine. It also means we use a high bar for the word “detection.”
2. Husham throttling detector overview and specifications
What loads in the browser
There is no box and no app to install. The page shows quick network facts, a large “Start Throttling Test” action, metric explainers, and a final green or orange verdict.
No purchase or subscription is shown on the test page.
The site says it compares five network providers or CDN paths.
Download, upload, ping, jitter, bufferbloat, and a verdict.
Runs in modern browsers on phones and computers.
Who it is for
The plain language aims at home users, IPTV viewers, gamers, remote workers, and people who think their provider slows certain services. Power users may value the multi-path clue, but they will want raw samples, server names, timestamps, and exportable data.
3. Interface design and service reliability
The dark dashboard is direct. Large labels make the test easy to scan. The short explainers for ping, jitter, and bufferbloat are written for normal consumers, not network engineers.
Documented interface map reconstructed from the public page copy. It is not a captured test result and does not show invented measurements.
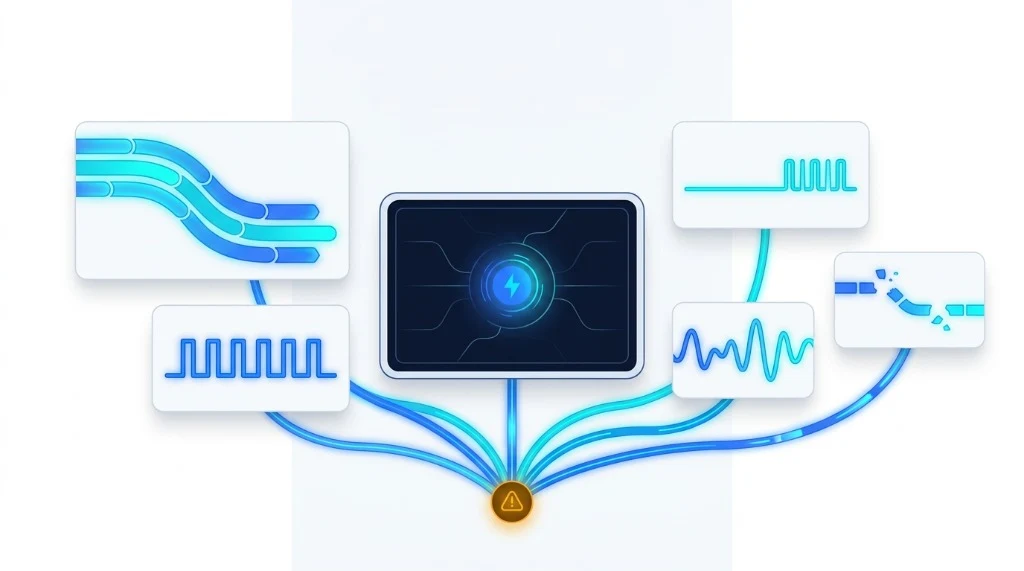
Diagnostic telemetry architecture: How modern throttling detection tools capture raw throughput streams, ping pulses, jitter frequency, bufferbloat queues, and packet fragmentation to flag performance anomalies.
The weak point is auditability. A durable diagnostic service should name each target, explain its traffic pattern, expose sample counts, and let the reader download results. If any endpoint changes or slows down, the final verdict can change even when the ISP does nothing.
Long-term durability
For a web service, “build quality” means uptime, stable test servers, clear version notes, and a method that can be checked. The public page is simple, but the available evidence does not yet show independent uptime data, a version history, or a full technical method.
4. Performance analysis: can it detect ISP throttling?
4.1 Core function
The service runs traffic against several providers. It then compares speed and latency. This can reveal an outlier path. That is useful. But an outlier has many possible causes:
- the remote server was busy;
- your ISP had a weak route or congested peering to that CDN;
- Wi-Fi interference slowed one part of the run;
- the browser or device hit a CPU/hardware limit;
- a VPN took a better route;
- the ISP applied deliberate traffic management.
Only the last item is deliberate throttling. A browser test cannot separate these causes in one run.
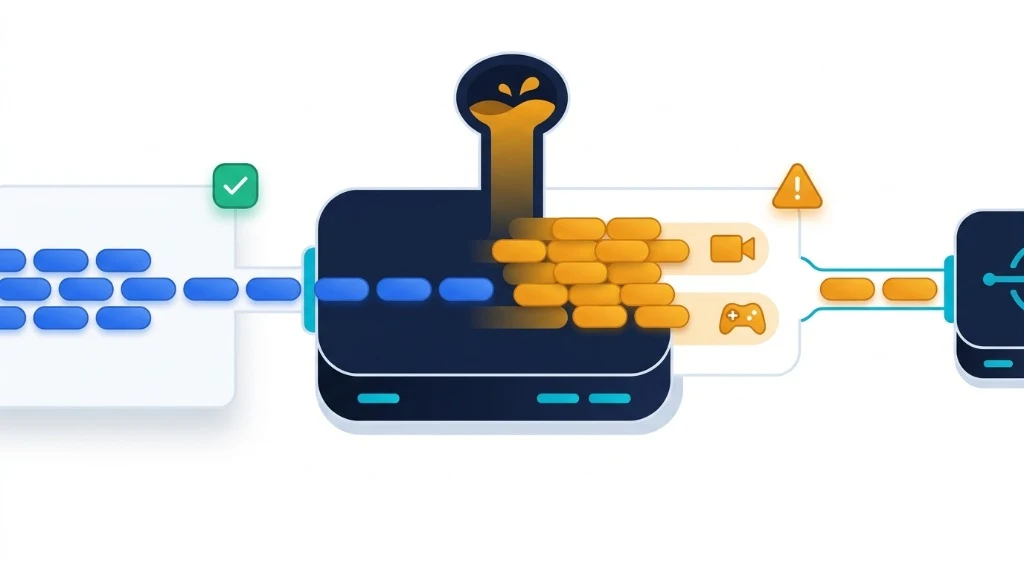
Selective traffic shaping mechanism: How ISPs implement token bucket policers and deep packet inspection (DPI) to choke streaming (video) and gaming queues into constricted pipelines while leaving standard web traffic unthrottled.
4.2 Three performance categories
| Category | What good looks like | What Husham offers | What is still missing |
|---|---|---|---|
| Throughput repeatability | Low spread across repeated wired runs | Download and upload across several targets | Published run count, target capacity, confidence range |
| Loaded latency | Idle ping stays close to ping during load | Bufferbloat and jitter reporting | Raw time series, percentile rules, grade thresholds |
| Throttling evidence | Same service is slower without VPN across time, while controls stay stable | Cross-provider outlier warning | Protocol-specific controls, VPN A/B, route data, repeat tests |
Real-world test protocol
To differentiate between local radio interference and genuine ISP network management, isolating your local connection baseline is essential:
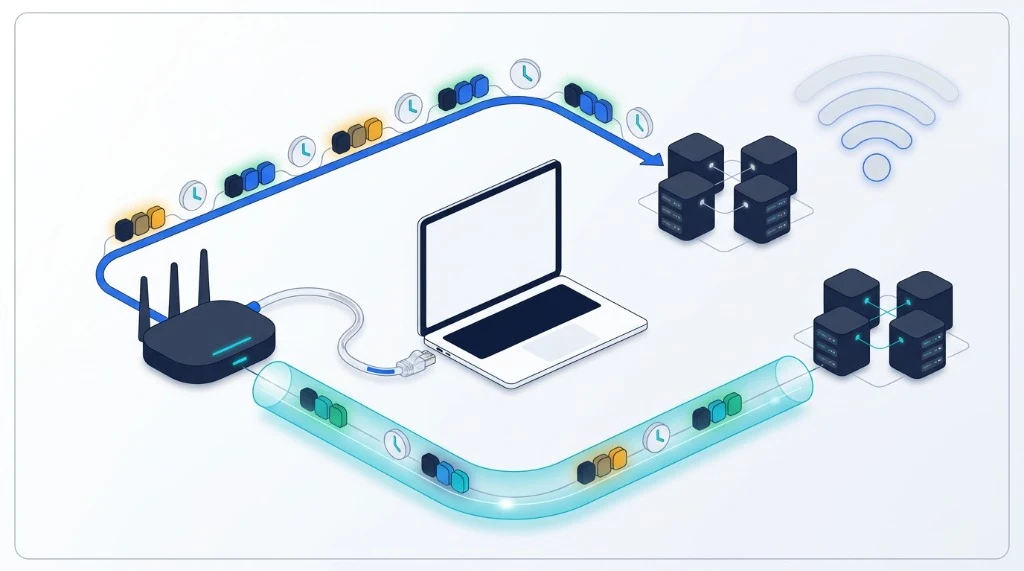
Controlled diagnostic protocol: Benchmarking over a dedicated shielded wired Ethernet conduit eliminates Wi-Fi airtime contention and local packet queue delays before running multi-CDN and VPN comparative runs.
- Use Ethernet. Turn off Wi-Fi for the test device.
- Pause cloud sync, game downloads, backups, and background streaming.
- Run Husham three times at off-peak hours.
- Repeat three times at the time the problem normally appears.
- Run VelocityVerify, Fast.com, and Waveform in the same sessions.
- Repeat with a nearby VPN server. Keep every result.
- Check traceroute or MTR for route changes and packet loss.
5. Interactive throttling evidence worksheet
Enter your own same-session results below. This tool runs entirely in your browser and does not contact any external server. It helps you evaluate whether you have a minor clue or a pattern worth deeper testing.
Compare speed, VPN uplift, and loaded latency
6. User experience
Setup is easy: open the page and start. The learning curve is low because each metric has a short definition. That is a real strength.
Daily use is less clear. A person trying to build a case needs named results, saved history, timestamps, and an export. Without those items, it is easy to compare screenshots from different conditions and reach the wrong answer.
7. Husham speed test versus alternatives
| Tool | Best use | Loaded latency | Key difference |
|---|---|---|---|
| Husham | Fast multi-provider screening | Yes, claimed | Simple possible-throttling verdict |
| VelocityVerify | Real-world speed & bufferbloat | Yes (A–F grade) | Independent multi-stream bare-metal routing |
| Fast.com | Netflix-path comparison | Yes | Useful when video streaming performance is the issue |
| Cloudflare Speed Test | Detailed web connection metrics | Yes | Latency, jitter, loss, and percentile detail |
| Waveform | Consumer bufferbloat grading | Yes | Clear loaded-latency grade |
| iPerf3 / Crusader / Flent | Controlled expert testing | Tool-dependent | You control both ends or the test profile |
Choose Husham when you want a quick clue across several providers. Choose VelocityVerify or Waveform for clear bufferbloat measurement. Choose Cloudflare for detailed browser metrics. Choose a controlled tool such as iPerf3 or Crusader when the result must stand up to rigorous technical review.
Video: the vendor’s own problem framing
Vendor video, not independent proof. Embedded for context on the use case and claims.
Video: Husham on provider slowdowns
8. Pros and cons
What we liked
- Free and quick to start
- Looks beyond one speed-test server
- Includes jitter and bufferbloat
- Explains terms in plain language
- Uses cautious “possible” wording
Areas to improve
- No public full methodology found
- No confidence score or repeat-run logic
- No clear raw sample export
- An outlier CDN is not proof of throttling
- No independent accuracy study found
9. Evolution and updates
The service was announced in July 2026. I found no public version log or long-term independent test history. The most useful next updates would be:
- a public methodology page with endpoint names and thresholds;
- CSV or JSON export with raw time samples;
- three-run median and confidence bands;
- an automatic wired/Wi-Fi warning;
- VPN A/B and route-change guidance;
- clear separation between congestion, peering trouble, and suspected shaping.
10. Recommendations
Best for
- Home users who need a first check
- IPTV or streaming slowdowns
- Gamers checking jitter and loaded latency
- People willing to repeat tests
Skip if
- You need legal or regulatory proof
- You need a controlled lab benchmark
- You cannot test over Ethernet
- You need raw packet or route evidence
Alternatives: Waveform and VelocityVerify for easy bufferbloat checks, Cloudflare for detailed web metrics, Ookla for a broad baseline, Fast.com for a Netflix-path comparison, and Flent or Crusader for deeper testing.
11. Where to use it
The Husham test is free at speedtest.husham.com. There is no retailer or paid plan to compare. Use the official page, check that the address is correct, and avoid clones that ask for a payment or an app install.
There are no seasonal deals to watch. The real “cost” is bandwidth: repeated multi-provider runs can use a meaningful amount of data, especially on a fast line or metered mobile plan.
12. Final verdict
Provisional rating: 6.5/10. The Husham ISP throttling detector is a useful screen. It is not a final verdict.
The multi-CDN idea is stronger than a one-server speed test. The simple layout is easy to understand. Yet the service needs a public method, raw exports, repeated-run statistics, and independent validation before its orange warning can carry much weight.
Bottom line: run it, save the result, and then test the same issue with Ethernet, another service, a VPN, and a second time window. If the pattern repeats, investigate. If it appears once, do not accuse your ISP.
13. Evidence, screenshots, videos, and 2025 user context
Reviewed
Reviewed
Pending
Verifiable 2025 category testimonials
Because Husham’s tool launched in 2026, these are not product endorsements. They show why speed alone can mislead people.
“My speeds are as advertised, roughly 950/36mbps… I get massive stuttering whenever any amount of load hits my network.”HardForum user discussion, Feb. 2025 — source
“The OP does not have an issue with speed, but with bufferbloat… faster is not automatically better.”Whirlpool community discussion, Aug. 2025 — source
“High ping (750+ ms) while downloading could be due to network congestion or QoS settings.”OPNsense community discussion, Sep. 2025 — source
Research sources
- Husham live test and disclaimer
- Husham launch post
- Waveform bufferbloat test and method notes
- Bufferbloat.net testing guide
- NetBeez’s Oct. 2025 Crusader review

About the Reviewer: Younes Kirat
Younes is a certified Cisco Network Associate (CCNA) and Wireless Network Administrator (CWNA) leading network diagnostics at VelocityVerify. He evaluates broadband measurement methodologies, traffic shaping, and latency under load.
Think your provider is slowing you down?
Benchmark your raw bandwidth, loaded latency, and bufferbloat grade across independent bare-metal servers.
Run VelocityVerify Speed Test